
Page last updated: October 12, 2019
All pages copyright © 2019 by Acquired Intelligence, Inc.

Help support our free offerings... Shop at Pinyon Publishing.


Thanks!


BIOGEOSIM
Biogeography software for ecologists
BioGeoSim is an interactive computer program for biogeography analysis of species ranges.
BioGeoSim runs in the Windows operating environment.
Copyright © 2019 by Acquired Intelligence, Inc.
GARY ENTSMINGER gle@garyentsminger.com
BioGeoSim simulates the stochastic origin and spread of species geographic ranges in a heterogeneous landscape (Rahbek et al. 2007). The landscape is represented as a gridded domain map, with the rows and columns representing the geographic coordinates of the domain. Entries of 0 indicate grid cells that are not part of the domain (e.g., ocean or water grid cells for a terrestrial domain). Positive real-number entries represent grid cell values of environmental variables (e.g., temperature or NPP), measured for each grid cell in the domain. Each species geographic range is mapped in a separate gridded file, with 1s and 0s corresponding to presence or absence of a species at a grid cell in the domain.
Citing BioGeoSim: Gotelli, N.J., G.L. Entsminger, C. Rahbek, & G. R. Graves. 2011. BioGeooSim: Biogeography software for Ecologists. Acquired Intelligence Inc. & Kesey-Bear. Jericho, VT 05465. http://garyentsminger.com/biogecosim.htm.
Thanks to:
NICK GOTELLI, CARSTEN RAHBEK, GARY GRAVES, & ROB COLWELL for helping make this project possible.

BioGeoSim Downloads

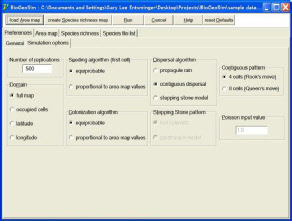
BioGeoSim uses these data to simulate the stochastic placement of each species within the domain. In simple models, all grid cells are equiprobable. In more complex models, the probability of occurrence in a grid cell is proportional to the environmental variable in that grid cell. Geographic ranges may spread through strict range cohesion, complete scatter of occurrences, or a Poisson dispersal model, in which each subsequent cell is colonized by dispersal from an occupied cell.
BioGeoSim calculates the observed species richness in each cell, once all species have been distributed in the model. After a given number of stochastic replications, BioGeoSim calculates the average species richness per grid cell. These expected values are then used in an additional set of stochastic iterations to calculate a goodness-of-fit deviation and compare it to the deviations from the observed data (i.e., a classic null model test).
Finally, BioGeoSim calculates a simple linear regression statistic of observed versus predicted species richness for all grid cells. If the model fits the data perfectly, the fitted regression line would have a slope of 1.0 and an r2 value of 1.0.

Recent Publications